Local Search Grids are powerful tools, but questions about Local Search Grid accuracy are common. What looks like “bad data” is usually a reflection of how local search actually works.
So let’s address the question almost every business owner asks after running a grid report: Why does it look inconsistent? Can I trust it?
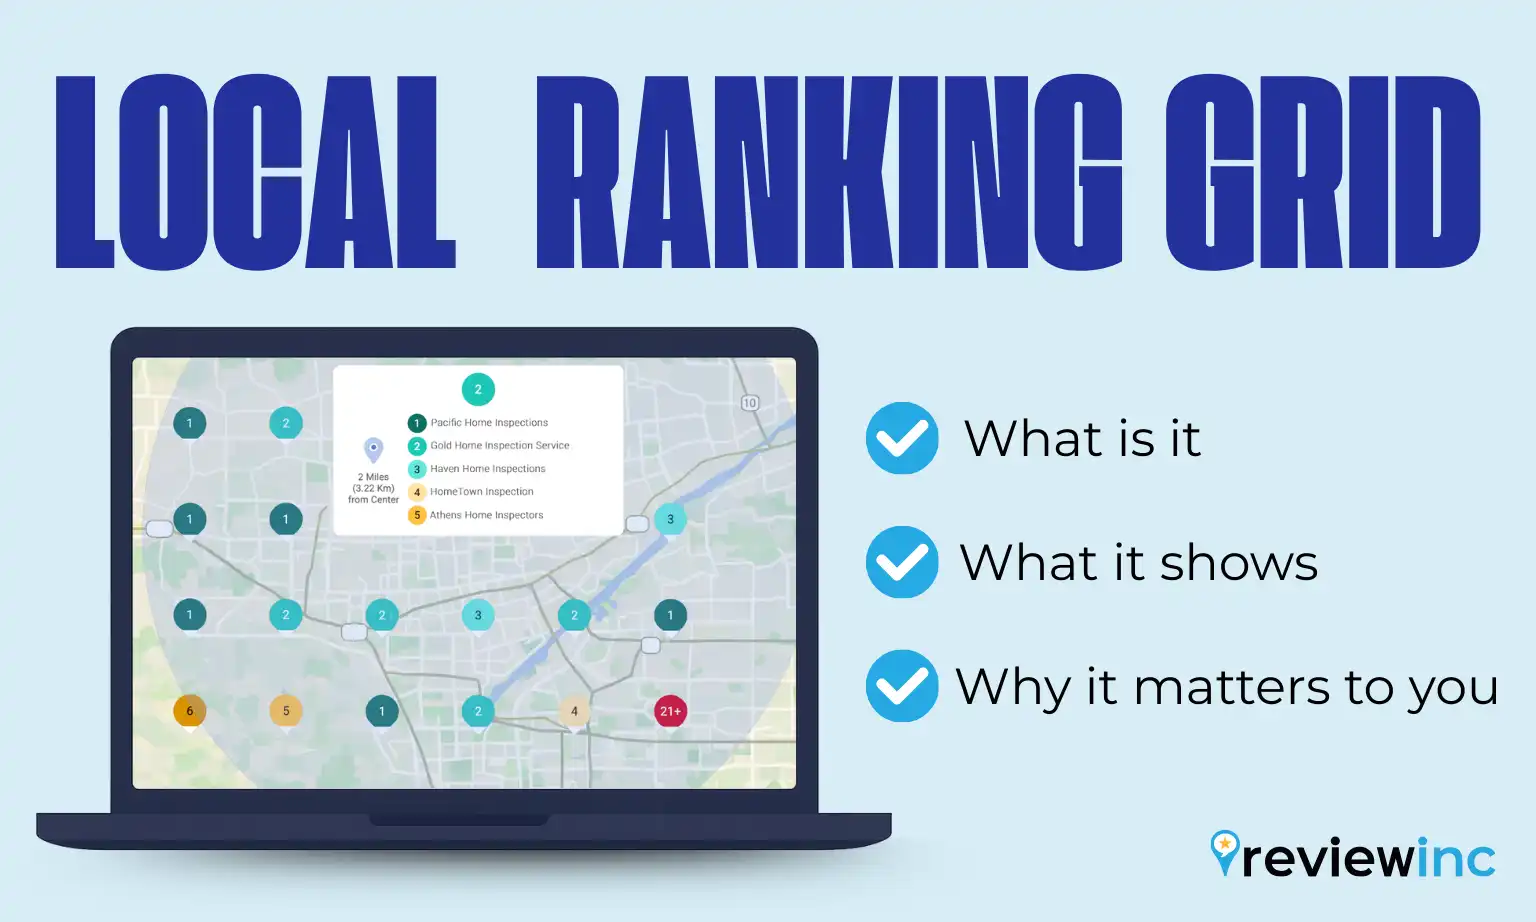
If you read our Local Ranking Grid Report Guide, you already understand what a local search grid report shows, why it’s important, and how to understand it.
Let’s break down why your grid might look skewed and how to interpret it correctly.
In This Guide
Local Search Grid Accuracy
- Proximity to the searcher
- Business hours
- Category relevance
- Review signals
- Competition density
- Personalization
- Google’s filtering systems
This is where Local Search Grid accuracy is often misunderstood. Reports that look wrong are often accurately reflecting how Google’s local algorithm behaves across different geographic regions, devices, and search conditions.
Why Your Grid Looks Inconsistent
1. Proximity Changes Everything
Proximity shifts are among the main reasons Local Search Grid accuracy is questioned. And, in local search, proximity is a primary ranking factor.
A business can rank in the top 3 just a few blocks away and drop significantly a mile down the road. That fluctuation isn’t a reporting problem. It’s how local search is structured.
If your grid spans:
- Residential zones
- Commercial corridors
- Industrial areas
- Low-density neighborhoods
You might see dramatic variation. That’s normal and expected.
Also, a business owner searching while connected to the business’s own Wi-Fi or within the physical building creates a ‘proximity bias’ that grid tools don’t have.
2. Competition Density Skews Results
Some parts of your city have more competitors than others.
In dense areas:
- Rankings fluctuate more
- Map packs rotate more frequently
- Minor signals (reviews, categories, engagement) carry more weight
In lower-density areas:
- Results are more stable
- Fewer competitors create stronger dominance
When evaluating Local Search Grid accuracy, compare areas with similar levels of competition rather than treating the entire grid as a single uniform result.
3. Business Hours Can Impact Visibility
Since 2023, Google has treated open businesses differently from closed ones, especially for time-sensitive categories, and significantly de-ranks businesses in the local pack during hours they are marked as “Closed.”
Your grid may shift temporarily if:
- Your business is closed
- A competitor is open 24/7
- The search occurs outside peak hours
For cleaner benchmarking, run reports during normal operating hours.
That said, running reports while you’re closed isn’t necessarily wrong. It shows what real users see after hours and can reveal competitor advantages. If a competitor stays open later or offers 24/7 service, you’ll see exactly how they take over the map pack, which can inform scheduling, staffing, or service strategy decisions.
Where Does Your Business Really Rank?
See your true visibility across every neighborhood you serve
User-Centric Search And Local Search Grid Accuracy
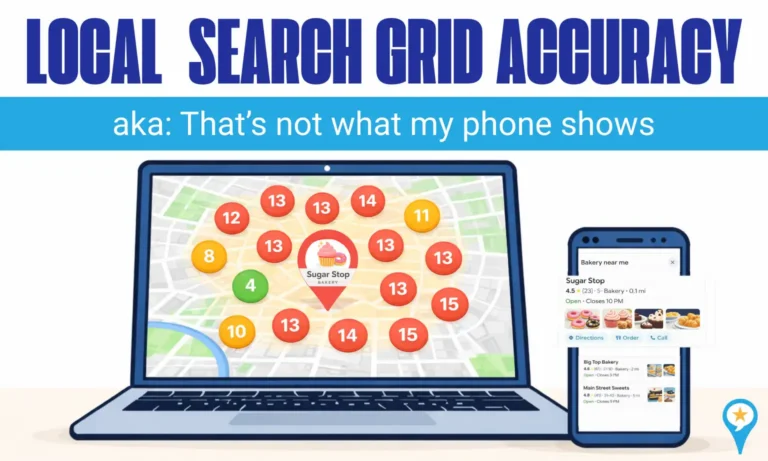
When a grid report looks inconsistent with what someone sees on their phone, they often question Local Search Grid accuracy, but user-centricity is usually the cause.
Google personalizes results using behavior signals, location data, device type, and past interactions, which means no two users necessarily see the same map pack.
Here is how user-centricity can make your report appear inaccurate:
1. The “Clean Slate” Bias:
Local search grid tools run searches in a neutral, logged-out environment to create a baseline. Real users, however, are usually logged in. Google uses saved Home and Work locations as anchors, often boosting businesses near those spots, which doesn’t affect a grid report.
2. The Loyalty Effect:
Google favors businesses that a user has interacted with before. If an owner or loyal customer checks rankings, Google may boost that listing because of past clicks or visits. A grid tool has no history, so it shows what a brand-new customer would see.
3. Device-Specific Weighting:
A grid report is a simulation. Someone searching on a desktop at work may see different results than a person walking past your storefront on their phone. Factors like cellular signal strength, GPS precision, and even whether the user is moving can cause live results to shift.
Grid reports provide a clean, level baseline. Real-world searches are influenced by the device in the user’s hand.
4. Search History Carryover:
Google doesn’t treat searches as one-time events. If someone searches “emergency plumber,” their next search for “plumber” may still favor emergency services. Grid tools run isolated searches, so they don’t capture this search journey, which can make results look inconsistent.
5. Open vs. Closed Status:
Google prioritizes open businesses. If a grid runs at midnight but someone checks rankings at 10 AM, differences may simply reflect real-time business hours, not inaccurate data.
The bottom line: The grid shows geographic potential. User-centric behavior shapes what individuals actually see.
How to Interpret Grid Patterns Correctly
Instead of focusing on individual red or green spots, look for patterns.
- Stronger near the address
- Weaker in high-competition zones
- Clustered gaps
- Consistent competitor dominance pockets
Grids are diagnostic tools. They show strategy opportunities, not just rankings.
Your Reputation is Your Ranking
Local visibility isn’t just about where you appear on a map; it’s about how much Google trusts your business. Your grid results rise and fall based on your reputation signals.
To stay competitive, you need:
- Review Momentum: A consistent flow of new reviews tells Google you’re active, relevant, and still serving customers.
- A Complete, Accurate Profile: Every missing or outdated detail on your Google Business Profile is a chance for a competitor to outrank you.
- Active Engagement: Responding to reviews and posting updates signals that your business is responsive and trustworthy.
- Proactive Monitoring: Addressing negative feedback early helps prevent sudden ranking drops.
Think of these signals as the fuel behind your grid performance. Without a strong reputation strategy, even solid SEO won’t keep you in the top positions.
ReviewInc’s Visibility Report goes beyond just a Ranking Grid to show your Reputation score, Business Listings accuracy, AI search rankings, Competition score, and Website readiness.
Questions about Local Search Grid Accuracy
What are Local Search Grids?
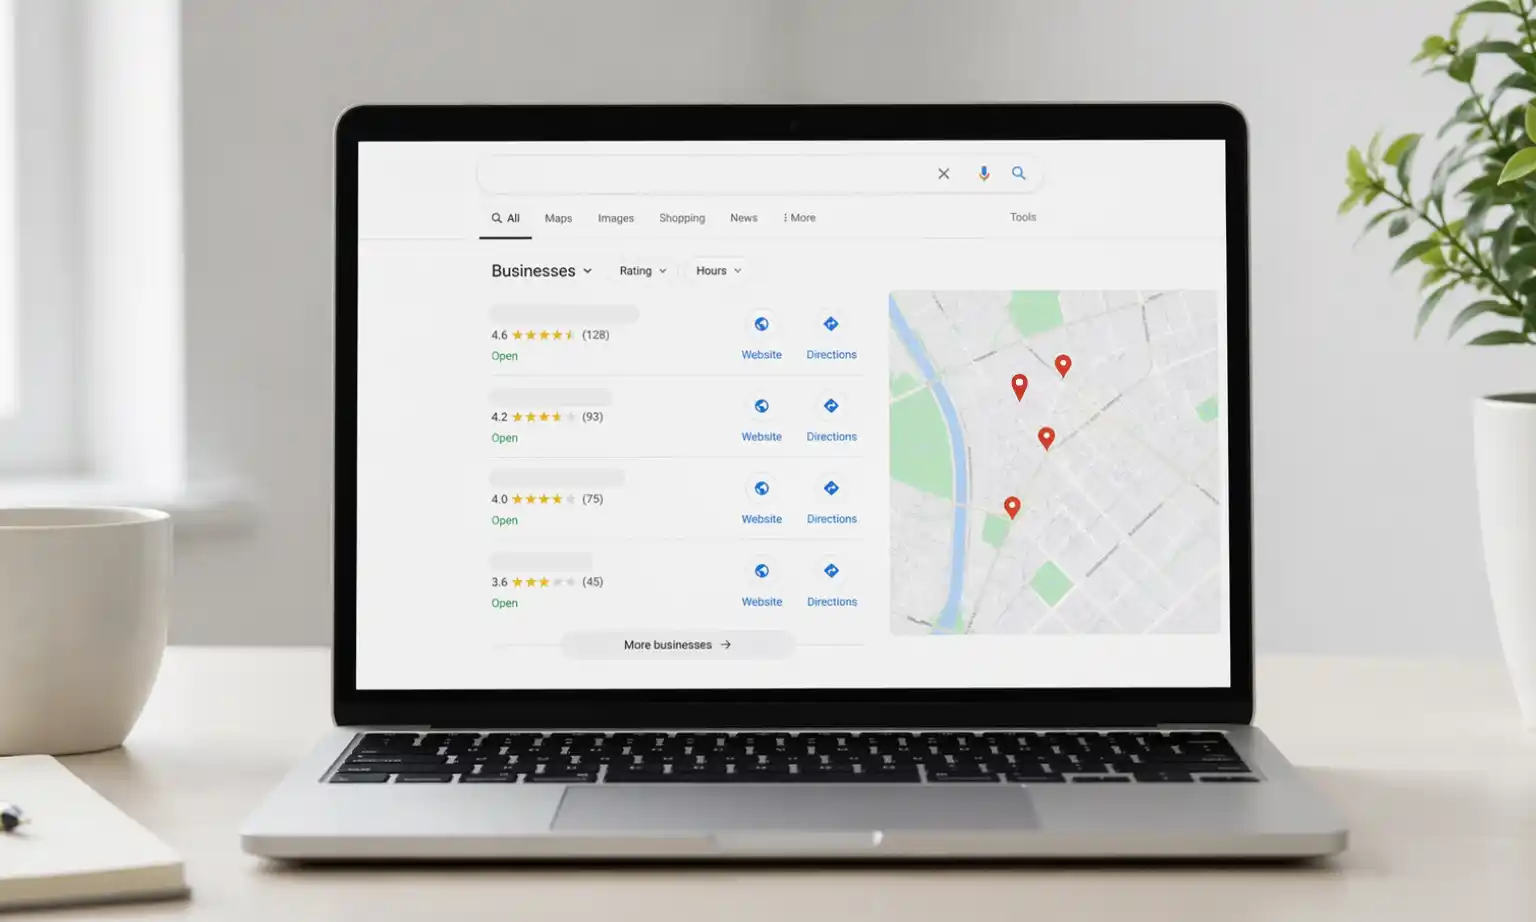
Local search grids (also known as search grids, local map rank trackers, geo-grids) are visual reports that show how your business ranks across different points in a geographic area. Instead of checking rankings from one location, a grid displays your position at multiple intersections, helping you understand true map visibility across your service area.
For a breakdown of what they are, how to read them, and how your business can benefit, see our Local Ranking Grid Report Guide.
Are Local Search Grid Reports Accurate?
Yes, with this important distinction. Grid reports are accurate for a neutral searcher, not a personalized one.
Think of a grid report as a controlled baseline. It strips away the human variables that influence everyday searches, things like:
- Search history
- Saved Home and Work locations
- Device type
- Brand familiarity
If your heat grid shows you ranking #3 at a specific intersection, that’s likely what a new customer standing there sees. The data isn’t wrong just because it doesn’t match your personal phone. It’s showing you the unbiased version of the map before personalization kicks in.
The key takeaway: A grid report shows geographic baseline visibility. What you see on your own device includes layers of personalization on top of that baseline.
Why do I rank at the top near my address but drop farther away?
This usually comes down to proximity. Google favors the closest relevant business to the searcher. As the search point moves farther from your location, competitors who are physically closer may replace you in the map pack — even if your reviews or profile are strong.
That shift isn’t a reporting error. It’s how local search is designed to work.
Why does my grid differ from my phone results?
Grid tools simulate neutral searches. Your phone results are personalized.
If you’re checking rankings while connected to your business Wi-Fi, Google recognizes that IP address and will often show your listing higher in that view. That doesn’t reflect what a typical customer sees.
The grid removes that bias and shows a more neutral baseline.
Why do my rankings look worse when my business is closed?
Google strongly prioritizes businesses that are currently open, especially for time-sensitive searches. If your report runs after hours, competitors that are open may temporarily move ahead of you.
That doesn’t mean your visibility is permanently weaker. It reflects real-time user intent. Running reports during business hours provides a cleaner benchmark, but running them while closed can reveal who gains ground when you’re offline.
What does it mean if I don’t show up at certain grid points?
Most grid tools track the Top 20 results in Google Maps. If you don’t appear at a specific point, it usually means you’re ranking outside the Top 20, not that you’re completely invisible.
That distinction matters. Moving from #21 to #18 is far easier than climbing from #80. These “gap” areas often just need stronger authority or relevance signals to reappear.
Can I rank in areas where I don’t have a physical location?
It can be difficult and it depends on your business type.
If you’re a Service Area Business (SAB), like a plumber or HVAC company, you can define service zones in your profile and rank across multiple areas without a storefront.
If you have a physical storefront, proximity is much harder to overcome. Reviews and category optimization alone rarely beat distance. In that case, building local content and earning backlinks from neighboring areas can help extend your reach.
How often should I run grid reports?
Monthly reporting is usually enough to spot meaningful trends without reacting to daily fluctuations. If you make major updates, such as adjusting categories, changing business hours, or launching a review campaign, run another scan within 1–2 weeks to measure the impact.
Consistency in timing leads to clearer trend data and more reliable benchmarking.