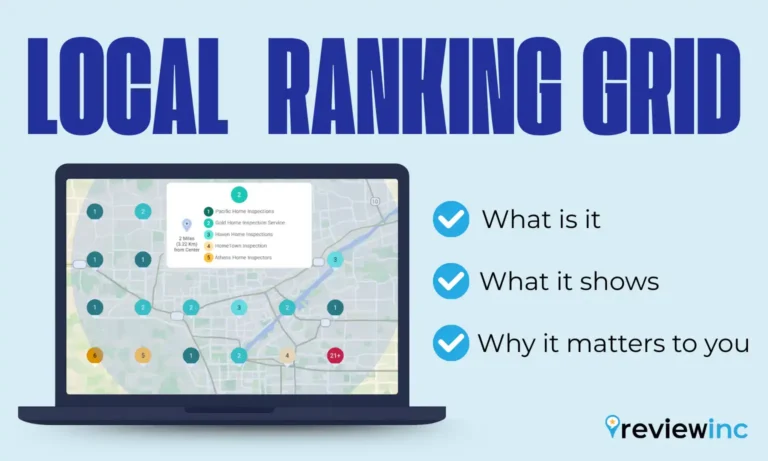
You’ve probably seen Local Ranking Grid reports (also known as search grids, local map rank trackers, geo-grids) all over Facebook and LinkedIn. Maps filled with green, yellow, and red dots. Claims of “real local rankings” and screenshots proving someone ranks #1.
Local ranking grid reports are extremely helpful to businesses, but only if you know what they are, what they show, and why they matter to your business.
In This Guide
What Is a Local Ranking Grid Report?
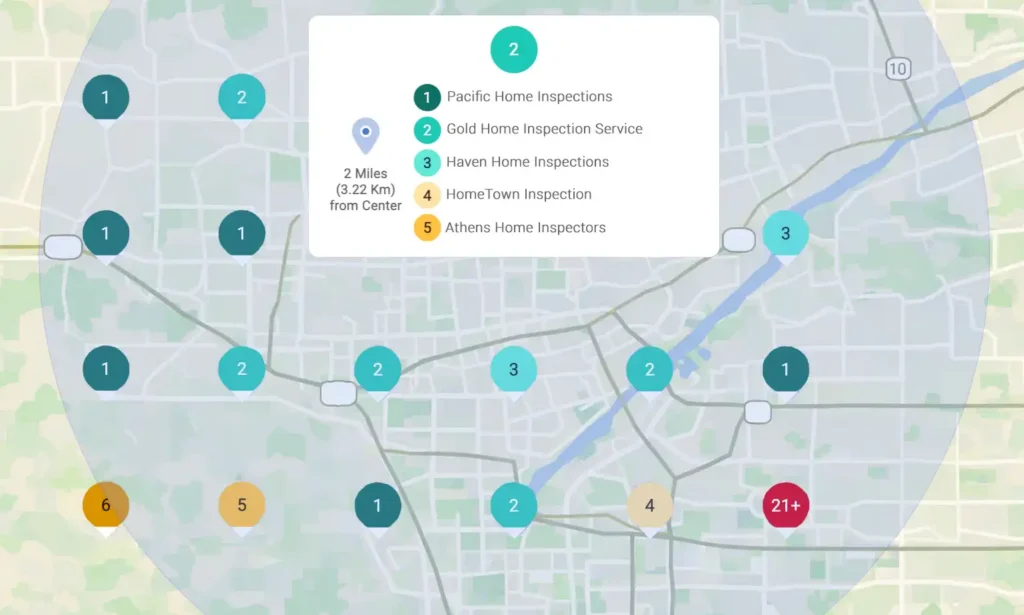
A Local Ranking Grid report is a visual, heatmap-style tool that shows how your business ranks in Google Maps local search results across multiple locations within your service area.
Instead of checking rankings from one central point, it places a grid over a city or neighborhood and measures your visibility from dozens of precise locations.
The result is a color-coded map that shows:
- Where you rank well
- Where your rank weakens
- Where you do not appear at all
Each marker represents your visibility from that specific location. This block-by-block view reveals patterns a single ranking number cannot. It shows where your visibility is strong, where it weakens, and where competitors dominate.
It answers the question: How visible is my business across the entire area I serve?
Why Local Rankings Change by Location
Many business owners assume there’s one ranking position. There isn’t.
Google uses proximity, relevance, and prominence to determine local results. That means:
- Someone searching two blocks away may see first
- Someone three miles away may see you fourth
- Another neighborhood might not show you at all
A Local Ranking Grid Report visually exposes those differences.
Where Does Your Business Really Rank?
See your true visibility across every neighborhood you serve
What a Local Ranking Grid Report Actually Shows
Unlike traditional rank trackers that check from a single location, a Local Ranking Grid report shows whether your rankings are limited to one pocket of the city or visible across your full service area.
-
Visibility Zones:
Instead of a single number, you see coverage patterns across neighborhoods.
Most grid reports use color coding:
- Green = Strong visibility
- Yellow/Orange = Moderate or unstable visibility
- Red = Low visibility
-
Your True Service Area Coverage:
Many businesses rank well near their physical address, but drop off quickly outside a small radius.
A Local Ranking Grid Report reveals:
- Where your authority is strongest
- Where competitors are winning
- Where customers may never see you
-
Ranking Volatility:
Local rankings fluctuate constantly.
By running reports monthly, businesses can:
- Track improvements
- Identify sudden drops
- Measure whether SEO efforts are expanding coverage
What a Local Ranking Grid Report Doesn't Do
It’s important to understand the limitations. A Local Ranking Grid Report does not:
- Automatically improve rankings
- Generate leads on its own
- Explain exactly why rankings differ
It’s a diagnostic tool. Think of it like an X-ray. It shows where the problem exists, not the treatment plan.
Why a Single “Local Ranking” Number Is Misleading
When someone says, “You rank number one on local search,” it sounds impressive. But there is a problem. There is no single local ranking.
Local search results vary depending on where the search is performed. If someone searches from:
- Two blocks away
- Across town
- A nearby suburb
- Inside a competitor’s stronger area
They may see completely different results.
So when you hear a search ranking number, the question should be: From where?
1. Rankings Are Location-Based, Not Universal
Unlike traditional organic rankings, local results are heavily influenced by proximity. You might:
- Rank number one near your office
- Rank number five three miles away
- Not appear at all in another neighborhood
A single ranking hides that variation, but a Local Ranking Grid Report can expose it by showing performance across multiple geographic points instead of just one.
2. A Single Number Creates False Confidence
If you check rankings from your own phone or office and see a strong position, it is easy to assume your visibility is solid across your service area. But your device:
- Uses your physical location
- May use search history
- May personalize results
That one snapshot does not represent the entire market. The grid helps remove that blind spot by simulating searches from multiple locations, giving you a broader and more accurate picture.
3. Customers Search From Everywhere
Your customers are not standing outside your building when they search. They are searching from:
- Their homes
- Their workplaces
- Different neighborhoods
- Surrounding suburbs
If you only rank strongly in a tight radius, large parts of your potential market may never see you.
A Local Ranking Grid Report shows whether your visibility is concentrated in one area or distributed across your service area.
4. Blind Spots Equal Lost Opportunity
If there are entire neighborhoods where you do not appear, those customers are not choosing you. They are choosing whoever shows up instead. A single ranking number cannot reveal those blind spots. A geographic grid can.
Rankings are also influenced by factors such as proximity, reviews, listings accuracy, and overall reputation signals. A Local Ranking Grid report does not explain every factor behind your rankings. It shows you the outcome, and it varies depending on where the search is run. And that difference matters.
How Businesses Should Use a Local Ranking Grid Report
-
Identify Opportunity Zones
Look for weak spots:
- Clusters of red or yellow areas
- Sharp drop-offs just outside your immediate location
- High-value areas where competitors consistently outrank you
This helps you focus on the parts of your service area where potential customers may not even see your business.
-
Measure Visibility Changes Over Time
Run the report regularly and compare results. You’re looking for:
- Overall expanding coverage zones
- Areas where weak zones are shrinking
- More consistent visibility across neighborhoods you serve
-
Set a Realistic Service Area Strategy
Use the grid to determine how far your visibility truly extends. If rankings consistently drop after a certain distance, that tells you:
- Where your digital authority weakens
- Whether your current service area goals are realistic
- How to align marketing expectations with actual reach
This prevents overpromising internally and helps define your true competitive radius.
-
Spot Competitor Dominance Patterns
A Local Ranking Grid report can reveal where specific competitors consistently outperform you and where they control entire sections of your service area.
If your grid includes competitor comparisons, use it to identify:- Which competitor dominates specific neighborhoods
- Whether one competitor consistently outranks you citywide
- Areas where competition is weaker and easier to win
Improving rankings often depends on understanding exactly who you are competing against in each neighborhood. This helps you determine whether visibility gaps are caused by proximity or competitive pressure.
Do Large Companies Benefit?
Yes, but often for reasons different from those of small businesses. It’s not about company size; it’s about whether local visibility impacts revenue.
Local Grid Ranking Reports for multi-location brands
Franchises, healthcare groups, dealership networks, and regional chains often benefit the most. Why?
- Each location competes within a different geographic radius
- Visibility can vary significantly by neighborhood
- Some locations may dominate while others underperform
- Corporate teams need consistent performance reporting across markets
A Local Ranking Grid Report helps identify which locations are strong and which need attention.
Local Grid Ranking Reports for large single-location businesses
Even large, well-known businesses single-location businesses can benefit.
They may:
- Rank strongly near their address, but lose visibility in surrounding areas
- Face dominant competitors in specific areas
The grid reveals how far their digital authority truly extends.
Local Grid Ranking Reports are about Visibility, not company size
If customers choose between nearby businesses in Google Maps, then a Local Ranking Grid Report is relevant whether the company is small or large.
Does Your Business Need a Local Ranking Grid Report?
You are more likely to benefit if:
- ✔ Customers choose your business based on proximity or “near me” searches
- ✔ You compete across multiple neighborhoods, zip codes, or suburbs
- ✔ Your visibility varies by location and you want to understand why
- ✔ You want measurable proof that your local visibility is expanding
You may not need it if:
- ✖ Customers do not choose your business based on location or proximity
Local Grid Rank Report Benefit by Industry
| Industry | Benefit Level | Why It Matters |
|---|---|---|
| Restaurant | High | Proximity strongly influences choice |
| Home Services | High | Competes across neighborhoods |
| Legal Services | High | Clients search locally by reputation |
| Healthcare | High | Local proximity drives selection |
| Automotive | High | Users search urgently nearby |
| Hotel | Medium | Local visibility helps, but many searches happen outside the city |
| Tourist Attraction | Medium | Benefits from local awareness but less grid-sensitive |
| Destination Resort | Low | Guests search from outside region |
| SaaS Platform | Low | Not proximity-based |
| E-Commerce | Low | No local map competition |
Benefit levels vary depending on search behavior and whether customers are searching from within the local market.
How to Improve Your Search Grid Rankings
A Local Ranking Grid Report shows you where you appear across your service area. If you see red zones or sharp drop-offs, that means visibility is inconsistent.
The next step is identifying what is causing those gaps. Improving grid rankings typically requires evaluating:
- How strong your overall visibility is compared to competitors
- Whether your business is appearing in AI-driven search results
- How your reputation and review profile compare locally
- Whether inaccurate or inconsistent listings are limiting exposure
- Whether your website performance supports stronger rankings
ReviewInc’s Visibility Report brings these elements together in one place so you can see what is influencing your local performance.
Local Ranking Grid reports show you where you rank. The Visibility Report helps identify what is affecting your rankings, so you can focus on fixing the issues limiting your visibility.
Connect with us to see exactly where your visibility stands and what is impacting it with a Visibility Report.
Questions?
What is a Local Ranking Grid Report?
Why do my rankings change across different neighborhoods?
Local rankings are heavily influenced by proximity. Someone searching from one area may see different results than someone searching a few miles away. The grid makes those geographic differences visible.
How does a local ranking grid report help improve rankings?
The grid shows where visibility drops. Once you identify weak areas, you can evaluate factors like competitor strength, reviews, listings accuracy, and website performance to determine what is limiting your visibility in those locations.
Is checking my ranking manually enough?
No. Manual checks are influenced by your location and search history. A local ranking grid report simulates searches from multiple geographic locations to provide a broader, more accurate view of your visibility.
Do all businesses benefit from local ranking grid reports?
Not necessarily. For businesses that rely on proximity and “near me” searches, it is valuable. Restaurants, home services, legal services, healthcare providers, and automotive businesses often see the highest impact.
If location does not influence how customers select you, it may not be necessary. Industries that do not compete geographically, such as pure e-commerce or national SaaS platforms, typically see limited value.
Do large or multi-location businesses benefit from local ranking grid reports?
Yes, especially if each location competes in its own geographic area. A Local Ranking Grid Report helps identify which locations are performing well, where visibility drops off, and how each branch compares to nearby competitors. It provides a consistent way to measure local performance across markets.
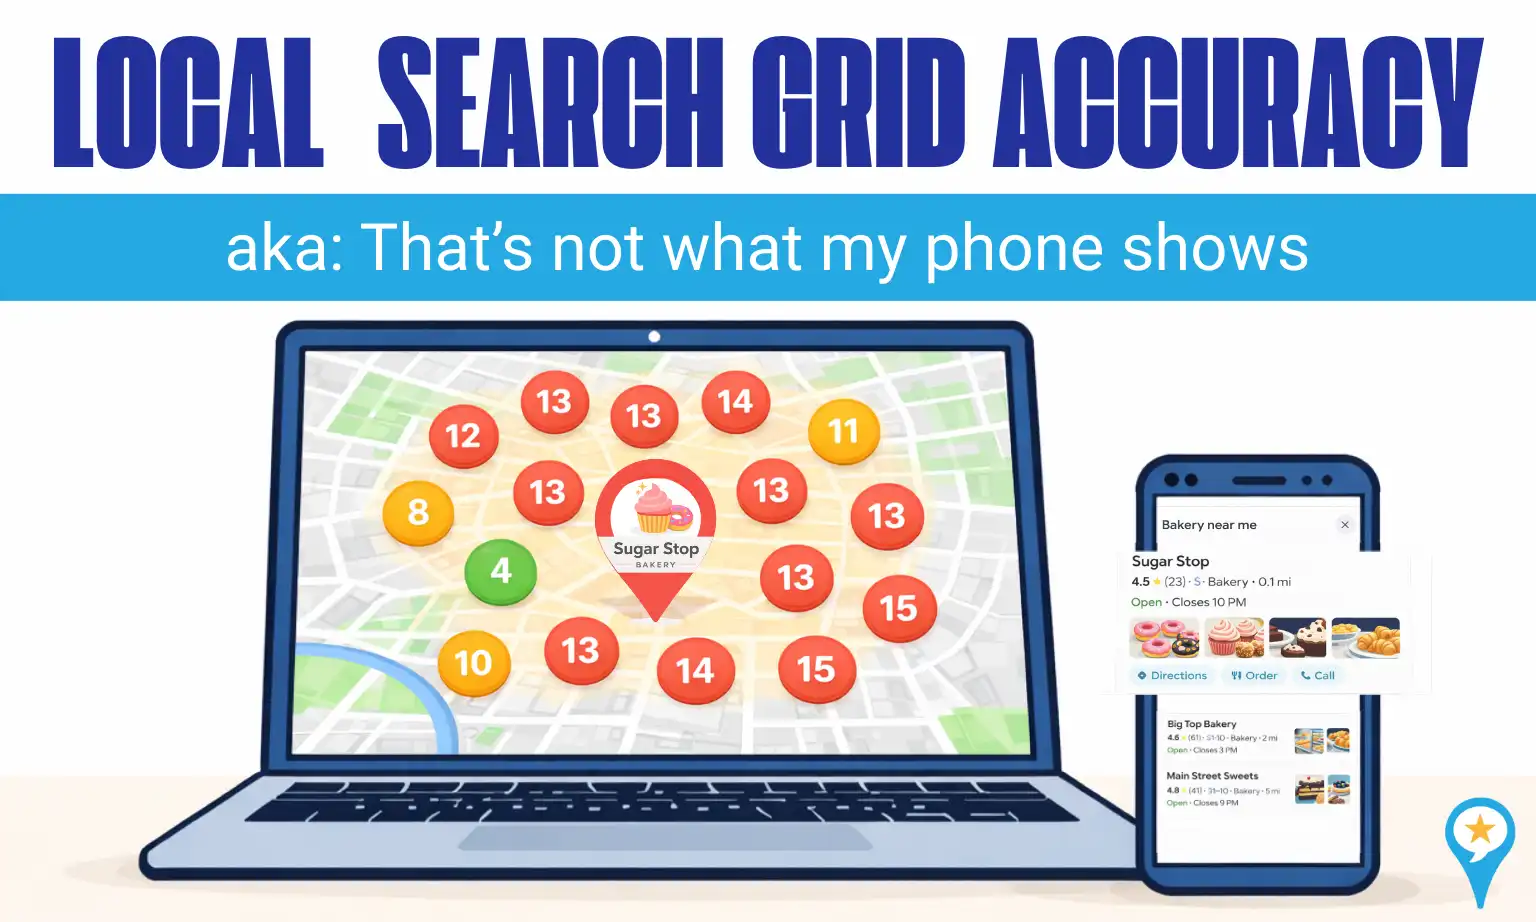
Are Local Ranking Grids accurate?
Yes, but keep in mind, they show rankings from a neutral, non-personalized perspective. Grid reports simulate what a typical searcher would see at different locations, not what you might see on your own phone.
If your grid results don’t match what you see personally, it’s usually due to personalization, proximity, or device differences.
For a deeper explanation of why grids can look inconsistent and how to interpret them correctly, read Why Your Local Search Grid Looks Inaccurate.
Can a local ranking grid report help identify spam or fake competitors?
Not directly, but it can reveal unusual ranking patterns. If a competitor dominates only a small, isolated pocket of a city, that pattern may warrant investigation.
It could indicate issues such as keyword-stuffed business names, virtual offices, duplicate listings, or other guideline violations.
However, it does not automatically mean spam. It may also reflect strong proximity signals, a highly concentrated customer base, or stronger reviews in that specific area.
When you notice this kind of dominance pattern, you can:
- Review the competitor’s listing details for inconsistencies
- Compare business names, categories, and addresses
- Check for duplicate or overlapping listings
- Report legitimate violations to Google
Even when the competitor is legitimate, the report can help determine whether the ranking gap is due to proximity, stronger local authority, or a review advantage.
Instead of guessing why you are not visible in one area, you can investigate with purpose and respond strategically.